 Aldo Benini
Humanitarian data analysis and modeling
Last updated: 28 January 2022
Back to Home page
The latest:
January 2022:
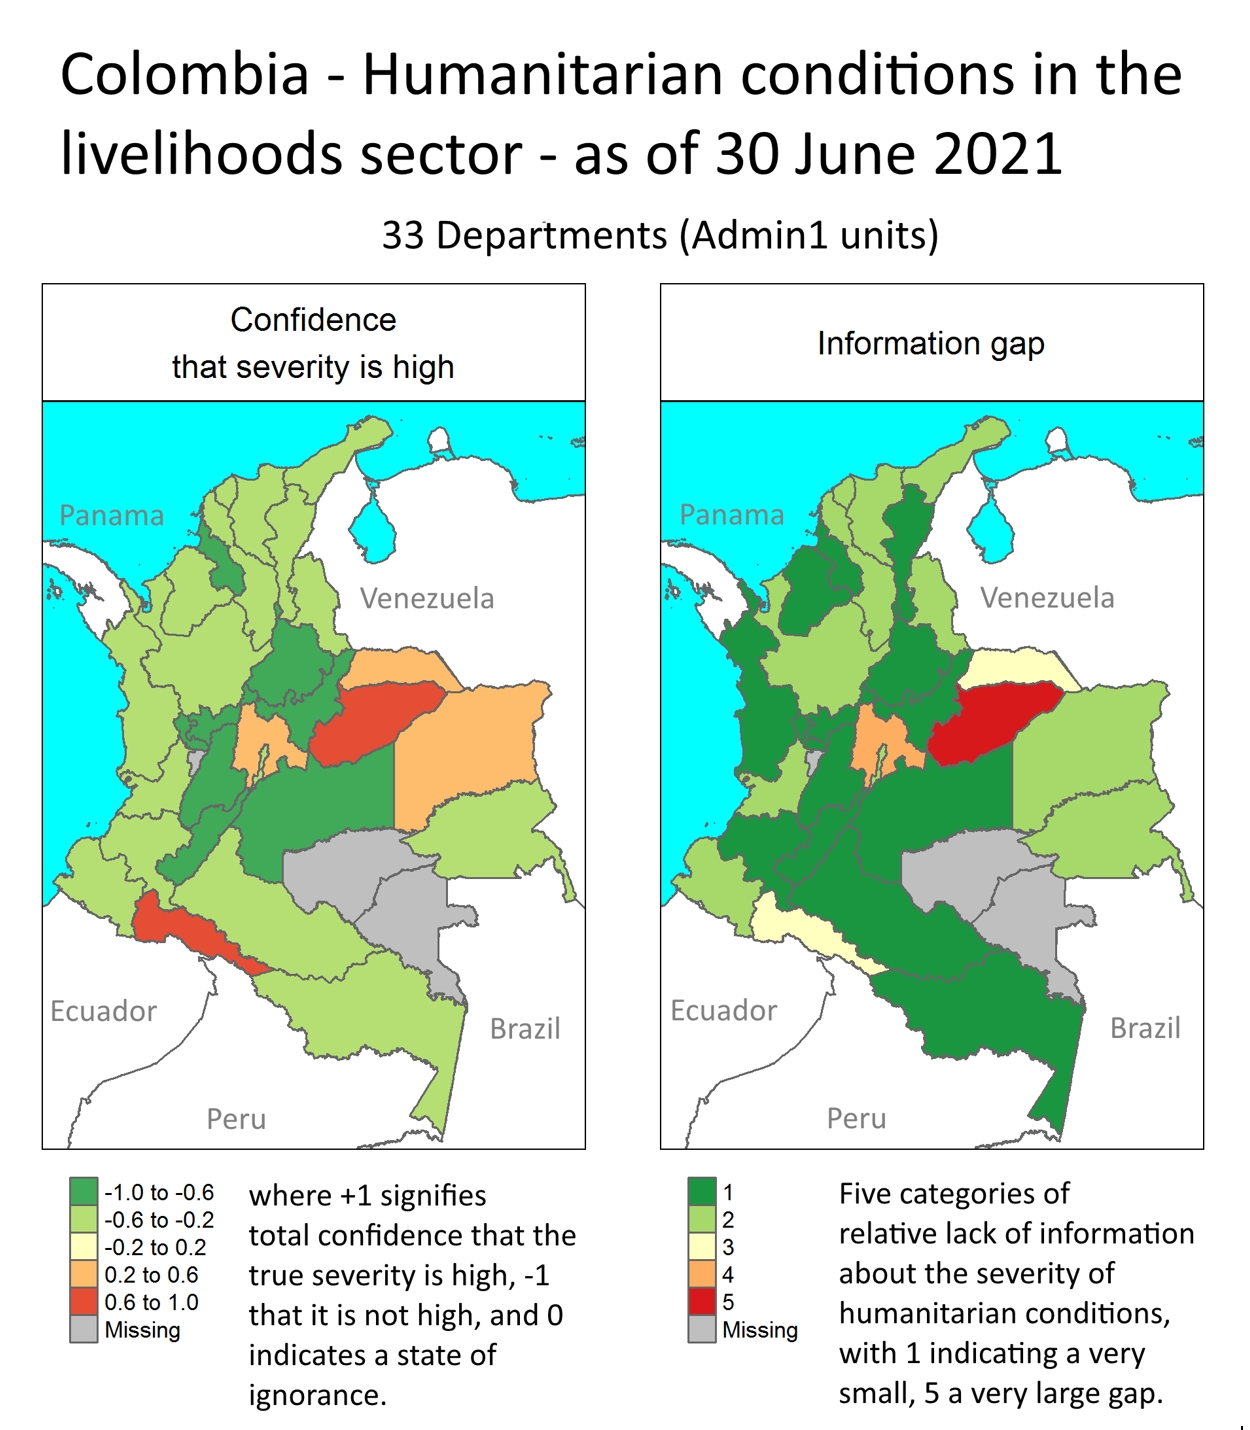
Humanitarian severity and information gap measures using Possibility Theory: Possibility Theory, a variant of probability theory, is well suited to analyze large-N measurements of variable reliability, obsolescence and redundancy. Very few applications are known from the humanitarian sector, and these are about stocks and flows of relief goods measured on continuous scales. We demonstrate the usefulness of Possibility Theory in testing the binary hypothesis that the severity of humanitarian conditions in a given region and sector is high / not high. The test relies on numerous ordinal severity ratings produced by coders who review humanitarian reports with location, time, sector, affected group and context information. Also, we propose an allied measure of information gaps.
The demonstration data are from
Colombia during a 14-month period in 2020-21. Two organizations, iMMAP and Data Friendly Space (DFS), collected, excerpted
and processed relevant documents of various types in a dedicated application.
This database delivered the information base for the Colombia Humanitarian
Needs Overview (HNO) 2021. The iMMAP / DFS coders
parsed 357 documents, from which we derived 24,920 observations each with a
location, publication date, sector and rating on a 5-level severity scale. Our
algorithm produces confidence and information gap estimates at the aggregate
level (pairs of Department [Admin1] and sector). All 33 Departments and 11
sectors are represented, although not for all pairs. See a map with two panels
for measures here.
The Excel demonstration workbook uses the data from a subset of six Departments, keeping 10,624 observations. The workbook architecture is such that the user can change parameter settings, view the updated outcomes in Department X sector tables, and compare them to the ones under the initial settings, all in the same sheet. Those interested in the inner workings find explanations in column header comments and in the “back office” sheets that do the work of aggregation and gap measure calculation. We suggest that readers first look at the companion note and then only experiment with the demonstration workbook.
R users will notice the lack of
packages implementing Possibility Theory as such. Those interested in imprecise
probability (models that tackle uncertainty and imprecision simultaneously) may
try to recast our algorithm – and invent better ones on their own – in terms of
the Dempster-Shafer Theory of Evidence, for which R
offers several packages, some of which the companion note mentions.
Conducted on behalf of DFS. José Cobos Romero
and I co-authored the companion note, which, together with the workbook, I
publish here at the suggestion of DFS.
Special credit is due to Patrice Chataigner, the iMMAP
Colombia and DFS teams, Matthew Smawfield and Attilio
Benini.
August 2021:
Tagging variables - How to make and use them in Excel and R: Quick and easy creation of tagging variables is a great feature of the statistical program Stata. Excel lacks a corresponding command; most Excel users may be unaware of tags and their benefits. Excel does offer functionality to easily create them. Tags are particularly powerful in tandem with the function SUMPRODUCT, with which many users are familiar. This workbook demonstrates how to make and use tags, on a gentle learning curve from the basic formula to a practical application. - R users find a shorter demo in this .Rmd, with credit due to Seth Caldwell and Attilio Benini.
June 2020:
Plackett-Luce trees for needs assessments: In needs assessments, respondents are frequently asked to rank unmet needs, survival challenges or sectoral priorities. The so-called Plackett-Luce model estimates from the ranking data their relative strength for the sample or population.
In addition, Plackett-Luce trees identify and visualize statistically distinct need / priority etc. profiles by social group in response to vulnerability attributes. The algorithm finds the significant distinguishing attributes from a list of variables specified by the user.
Plackett-Luce models may be particularly relevant in assessments with limited access (Covid-19!) and short questionnaires that still have room for questions about first and second (and ideally also third) priorities.
In this sample tree, based on
priorities expressed by Rohingya refugees in Bangladesh, four distinct profiles
result from splitting the sample multiple times. The first split is by a
categorical variable (the gender of the respondent for the household); the
female subsample is then split twice, by a numeric one (the maximum years of
formal
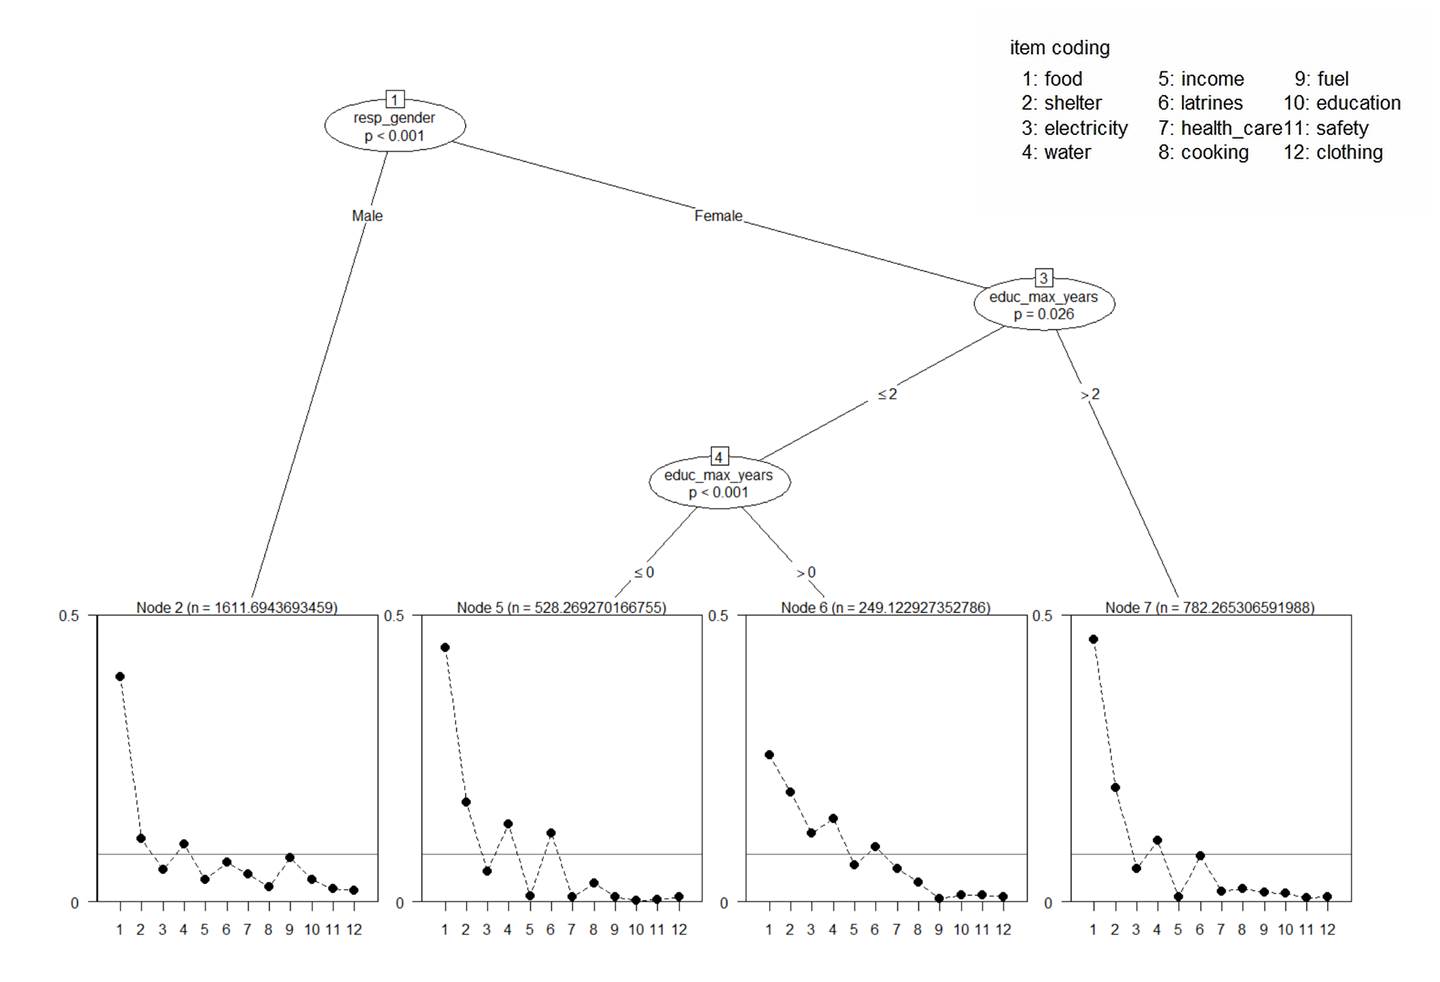
The x-axis numbers 1 - 12 in the rectangular terminal node plots are the codes for the choice items listed in the legend. The respondents chose a maximum of three as their first, second and third priorities.
The y-axis values express the strengths of the priorities. The strengths are normed in each profile to sum to 1. The horizontal line at y = 1/12 is the mean strength. The “n”-statistic on top is the sum of sampling weights of the subsample households.
The p-value in the oval internal nodes is the probability that the observed priorities in the two child node subsamples were generated from the same underlying preference pattern.
In other words, (1 – p) * 100% is our confidence level that in the wider population households contrasted on the attribute values, as shown in tree branches, hold truly different preferences.
The linked R code relies on the library “PlackettLuce”, with extensive help by my son Attilio Benini. We provide code for both the unconditional strength estimates as well as for group-sensitive trees. We show how to filter observations such that the trees can be calculated using sampling weights, a key requirement for survey data analysis.
The note “Plackett-Luce tree plot of ranked needs, by vulnerable groups” is a .html document. It details rationales, data structure and preparation, code segments as well as caveats to which the analyst needs to be attentive. The zipped .Rproj, .Rdm and .Rdata files can be downloaded here.
January 2020:
New software: mdepriv is an R package for combining binary, continuous and suitably transformed ordinal items/indicators of deprivation into synthetic measures of deprivation. As such, it is a tool of poverty analysis. It is suitable also for generating composite measures of severity and vulnerability in the humanitarian realm. The R implementation translates the original Stata version by Pi Alperin & Van Kerm (2009), with additional features (notably, non-integer sampling weights are admitted). mdepriv returns unit-level synthetic scores of multiple deprivation and their statistical summaries. It offers several methods for determining item/indicator weights in response to user preferences for rewarding better discrimination and penalizing redundancy. The methods include the Betti-Verma double-weighting rule, which I earlier demonstrated for Excel users, but now with more options and greater convenience in R.
The package was developed by my son Attilio Benini, with encouragement and support from Philippe Van Kerm, LISER Luxembourg; Patrice Chataigner, Okular Analytic; Edouard Legoupil, UNHCR; and myself. You find installation instructions and a first usage example at https://a-benini.github.io/mdepriv/. The help page mdepriv and the vignette Get started with mdepriv serve as detailed tutorials. The GitHub repository can be found at https://github.com/a-benini/mdepriv. For the time being, Attilio is the maintainer and addressee for bug reports.
June 2019 – This is a small technical addition to the next item below. For training or testing purposes, the need may arise to work with a set of simulated ordinal variables (such as from ratings) that approximate certain desired distributions and correlation patterns. This workbook demonstrates how to generate such artificial data in Excel. Some users, who are not interested in the mechanics and need only a one-time sample with max. 10 variables and 100 observations, may simple want to copy the sheet “SimulatedResponses”. - Hosted on behalf of Okular Analytics, Geneva.
January 2019 - A substantial part of the data that needs assessments collect arrive in the form of ratings and rankings. As such, they belong to the class of ordinal data. Legitimate options for aggregating ordinals are limited. There is a strong incentive to convert multiple ordinal measurements of an underlying common construct (such as deprivation) to a composite measure with metric qualities. In “Priorities and preferences in humanitarian needs assessments - Their measurement by rating and ranking methods”, I demonstrate several aggregation methods. Some, by design, remain at the ordinal level; others return interval-level and, rarely, ratio-level measures. I discuss methods for both case-focused and indicator-focused statistics and present formulas and code (most of it for Excel) for unweighted and population-weighted measures. Similar syntax allows users to calculate differences between groups. Specific sections are devoted to rank statistics (and, as an alternative, conversion to metric before aggregation), Copeland’s method for combining a variety of data types, the Borda count (interval level) and the less well known Plackett-Luce model (ratio level).
An Excel demonstration workbook lets users see the implementation of the selected methods in detail. Separately I provide R-code for the Plackett-Luce model that can be directly loaded into R Studio. The data either have been simulated for smaller demonstrations or are publicly available from two large rounds of site assessments in Rohingya refugee camps in Bangladesh in 2018.
Hosted on behalf of Okular Analytics, Geneva.
August 2018 – In “A new index of refugee protection”, Sean Ng and I analyze data on Rohingya camps in Bangladesh, collected from key informants in over 1,800 small camp blocks. Combining eighteen insecurity and six movement restriction indicators, we form an index of lack of protection. Notably, we borrow an algorithm from deprivation research that corrects weights downward on redundant indicators and upward on those with good discrimination. A map shows clusters of high and low index levels in the largest camp cluster; we also visualize the correlation patterns among indicators. We discuss conceptual issues and describe properties of the index.
This discussion note seeks to encourage work on quantitative measures of protection in the humanitarian community. The scope of our measure and the quality of the data are limited. We hope to improve on it as new rounds of data collection will provide indicators of a wider scope and data of stronger reliability.
July 2018 – Bayesian belief networks have become increasingly popular as tools in such varied analytic endeavors as prediction and forecast, scenario planning, knowledge representation, identification of uncertainties and data gaps, diagnosis, and collaborative decision-making. Moreover, believe networks are very amenable to combining qualitative and quantitative data.
In the neighborhood of humanitarian data analysis natural disaster and ecological scientists frequently use belief networks to model and estimate intricate cause-effect relationships. Although humanitarian researchers naturally conceptualize causal models, the use of Bayesian belief networks does not show up in the publicly referenced literature. This abstinence from a versatile tool – and, in the era of convenient, easy-to-learn, graphic interface-driven software, increasingly powerful one – is regrettable.
“Bayesian belief networks - Their use in humanitarian scenarios” invites data analysts (as well as assessment, policy and advocacy specialists, response planners and grant writers) to familiarize with the tool by way of a demonstration. From a recent (July 2018) briefing note by the Assessment Capacities Project (ACAPS) on ethnic violence in Plateau State, Nigeria, I develop a simple probabilistic model of the possible evolution of displacement and disease outbreak in IDP camps between July and October. I present four forward- and backward-looking scenarios.
This model is primitive, arbitrary and utterly unfit to guide response planning. Readers may nonetheless discern the potential of Bayesian belief networks to expand humanitarian analysis – and feel encouraged to build and share their own.
Feb. 2018 – “Subjective Measures in Humanitarian Analysis” discusses the nature of subjective measures in general and their usefulness to humanitarian assessment designers and analysts in particular. Three techniques are presented in detail:
· Scales and ladders
· Anchoring vignettes
· Hypothetical questions.
Each chapter comes with extensive sidebars and case studies of, among others:
· Food Insecurity Experience Scale (translated into 200 languages and applied in 146 countries)
· Multidimensional deprivation with subjective data (the Alkire-Foster model, with an application to Nigeria)
· Vignettes in a living standards survey in Tajikistan (with a demonstration of how to transform welfare ranks in Excel)
· The marginal propensity to buy food among IDP households estimated from the response to a hypothetical question (as well as strategies to replace such questions with normative, expert or collective standards, such as in Basic Necessities Surveys).
I conclude by noting instruments likely to grow more important in years to come.
Conducted for, and mirrored from the Web site of, the Assessment Capacities Project (ACAPS), with permission.
2017 – “Can
severity profiles offer an alternative to persons-in-need estimates? - An
experiment with data from Syria” uses latent cluster analysis to assign
local communities to six different severity profiles (on conflict, health care
and 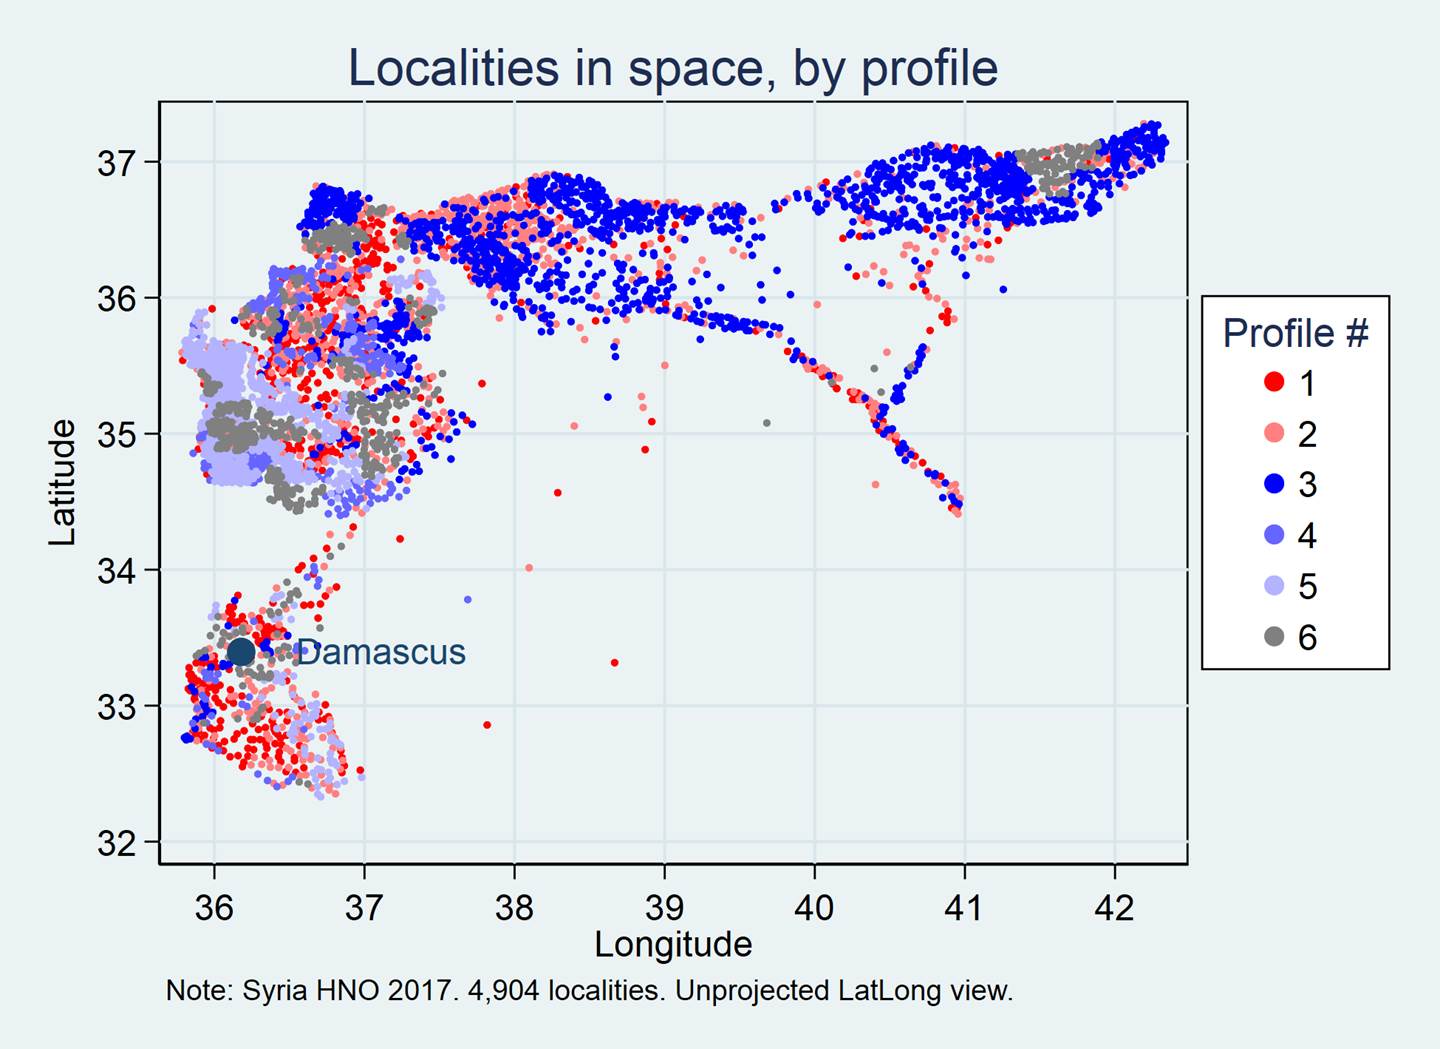 livelihoods
criteria). The profiles each have a
livelihoods
criteria). The profiles each have a
Conducted for, and mirrored from the Web site of, the Assessment Capacities Project (ACAPS), with permission.
2017 – “Expert Judgment. The use of expert judgment in humanitarian analysis. Theory, methods and applications” demonstrates the potential of this underrated research method for humanitarian analysis and decision-making. It covers the historic origins, the stages of the judgment process as well as applications in a variety of situations, discussed in nine case studies. The chapters on elicitation and aggregation methods are very detailed, interspersed with worked examples. A section on “expert judgment and Bayesian reasoning” introduces the reader to basics of process tracing, cause-effect testing and belief networks. Some futuristic speculation on expert judgment in the era of Big Data concludes.
I wrote this book-length study together with Patrice Chataigner, Nadia Noumri, Nic Parham, Jude Sweeney and Leonie Tax, all of them with the Assessment Capacities Project (ACAPS). Mirrored from the ACAPS Web site with permission.
2016 – “Severity measures in humanitarian needs assessments - Purpose, measurement, integration” analyzes the language and history of severity and its measurement in humanitarian discourse. It proceeds to describing and critiquing two major models of severity:
1. The sector-based model, illustrated with the 2016 Humanitarian Needs Assessment for Syria, and
2. The indicator-based model, for which several alternative measures are compared using 2015 Nepal earthquake data.
Recommended practices are detailed for both models. Some less well known analysis methods are demonstrated (Ridit and odds transformations, Borda count), and caveats are voiced about careless use of others (geometric mean, event count indicators).
Mirrored from the Assessment Capacities Project (ACAPS) Web site with permission.
2016 - Assessment registries, formerly known as “surveys of surveys”, are databases about the flow of needs assessments in a crisis or disaster zone. Their purpose is twofold:
1. The registries are archives of shared humanitarian intelligence.
2. They help monitor the distribution of the assessment effort, revealing coverage by areas, social groups and sectors, as well as open and emerging gaps.
“Information gaps in multiple needs assessments in disaster and conflict areas” addresses the second function. It discusses concepts of information value and information gaps as well as key lessons from analyzing collections of assessment reports in four recent crisis contexts (Syria, Ebola, Nigeria, Nepal). It presents a database template for future registries, supplied in a companion Excel workbook.
Patrice Chataigner, Nadia Noumri, Leonie Tax, Michael Wilkins and I co-authored the study. Mirrored from the Assessment Capacities Project (ACAPS) Web site with permission.
2016 – “Persistence of severity patterns over time”: After sudden-onset disasters, needs assessments may produce severity estimates repeatedly, apace with updated information. We expect updates to add new information; at the same time, if impacts last, we also expect that earlier severity estimates resonate in later ones. The extent to which severity persists is not well known. Two measurements in Nepal, following the earthquakes in 2015, provide an opportunity to study the degree and structure of persistence. UNOCHA produced severity measures for over 600 low-level administrative units in April and June. Using canonical correlations, I find a persistent severity pattern. High persistence may have practical implications for the timing of second and subsequent assessments. - Mirrored from the Assessment Capacities Project (ACAPS) Web site with permission.
2015 – Priority indices have grown popular for identifying communities most affected by disasters. Responders have produced a number of formats and formulas. Most of these combine indicators using weights and aggregations decided by analysts. Often the rationales for these are weak. In such situations, a data-driven methodology may be preferable. “The use of Data Envelopment Analysis to calculate priority scores in needs assessments” discusses the suitability of different approaches. It offers a basic tutorial of a DEA freeware application that works closely with MS Excel. The demo data are from the response to Typhoon Haiyan in the Philippines 2013. - Mirrored from the Assessment Capacities Project (ACAPS) Web site with permission.
2015 - Needs assessments in crises seek to establish, among other elements, the number of persons in need. “Persons in need” is a broad and fuzzy concept; the estimates that local key informants provide are highly uncertain. Would refining the categories of persons in need lead to more reliable estimates?
The Syria Multi-Sectoral Needs Assessment (MSNA), in autumn 2014, provided PiN estimates for 126 of the 270 sub-districts of the country. It differentiated between persons in moderate and those in acute need. "Moderate Need, Acute Need - Valid Categories for Humanitarian Needs Assessments?" tests the information value of this distinction. The results affirm that refined PiN categories can improve the measurement of unmet needs under conditions that rarely permit exact classification. The note ends with some technical recommendations for future assessments. - Mirrored from the Assessment Capacities Project (ACAPS) Web site with permission.
2015 - The same needs assessment in Syria occasioned a note on "Confidence in Needs Assessment Data. The Use of Confidence Ratings". The topic is important for two reasons: Rapid needs assessments rely more on expert judgment, provided by secondary data analysts, roving observers and local key informants, than on technical measurement. And: The blurring of lines between humanitarian and security concerns has opened a door for intelligence lingo and thereby for "confidence" talk. In Syria, however, humanitarian observers have had sufficient continuity to gradually improve systems on their own terms. Confidence ratings may have strengthened efforts to produce reliable data, but there is little evidence that the MSNA team used the ratings very much also in the analysis.
Mohammed Shikh Aiyob, Patrice Chataigner, Benoît Munsch and I co-authored the study. Mirrored from the Assessment Capacities Project (ACAPS) Web site with permission.
2014 - "Composite Measures of Local Disaster Impact - Lessons from Typhoon Yolanda" investigates the logic and scope of composite measures in crisis assessments. Such tools, also called prioritization matrices, have been increasingly used, often without sufficient conceptual bases. The study reviews four indices developed in the first weeks following the landfall of Typhoon Yolanda in the Philippines. It focuses on the emphases of the indices, the mechanics of combining indicators, and the statistical distributions of the final impact scores. It proposes alternative formulations for composite measures, and makes recommendations on how to improve the process in future rapid assessments.
Patrice Chataigner and I co-authored the study. Mirrored from the Assessment Capacities Project (ACAPS) Web site with permission. Readers can find an Excel demo workbook here.
2013 - Rapid assessments after disasters gauge the intensity of unmet needs across various spheres of life, commonly referred to as "sectors". Sometimes two different measures of needs are used concurrently - a "severity score" independently given in each sector and a "priority score", a relative measure comparing levels of needs to those of other sectors. Needs in every assessed locality are thus scored twice.
"Severity and priority - Their measurement in rapid needs assessments" clarifies the conceptual relationship . I wrote this note for the Assessment Capacities Project (ACAPS) in Geneva following the Second Joint Rapid Assessment of Northern Syria (J-RANS II) in May 2013. I investigate the construction and functioning of severity and priority scales, using data from Syria as well as from an earlier assessment in Yemen. In both assessments, the severity scales differentiated poorly. I therefore generated an artificial dataset to simulate what associations can realistically be expected between severity and priority measures. I discuss several alternative measurement formulations and the logic of comparisons among sectors and among affected locations.
Mirrored from the ACAPS site with permission. Readers who wish to replicate the simulation find Stata files here; I welcome new ideas in general and improvement to the code in particular.
2013 - What is the data analyst to do when he is handed a dataset over whose design and formatting he had little control or none? For the Assessment Capacities Project (ACAPS) in Geneva, I wrote two notes - "How to approach a dataset - Part 1: Data preparation" and "Part 2: Analysis". The target audience are rapid needs assessment teams, who often work under high time pressure. Yet analysts in project monitoring units, evaluators and trainers too may find the tools and process logic useful. Two macro-enabled Excel workbooks (for part 1 and part 2) show the train of preparation steps as well as a variety of frequently needed analysis forms.
Mirrored from the ACAPS site with permission. These materials speak to "one case - one record" data situations, which is typical of most surveys and assessments. For the special challenges that "one case - many records" datasets offer, see an example here below.
2012 - Needs assessments after sudden-onset disasters proceed under immense time pressure. In purposive sampling, teams visiting affected sites seek to optimize the rapport between suspected impact and logistic effort. They may have advance information on physical impacts, but get to know other impacts on site only.
How do teams learn beyond preset categories? How probable is a category change in response to more site visits, more difficult logistics, and measurement error? I explore this through a computer simulation of assessment team itineraries, with a spatial structure borrowed from the 2010 floods in Pakistan.
"A computer simulation of needs assessments in disasters" is the outgrowth of a project for the Assessment Capacities Project (ACAPS) in Geneva. The reader can replicate simulation runs in this spreadsheet here.
2012 - Again for the Assessment Capacities Project, I wrote a note on composite measures. The note is primarily concerned with their use in rapid needs assessments, but its scope extends to other areas of application as well.
"Composite measures" (which others interchangeably call "composite indicators", "indices", "metrics", or even "total scores") are explained for their conceptual background and with detailed technical guidance. Techniques recommended in the well-known OECD Handbook on Constructing Composite Measures are reviewed for their suitability in rapid assessments. Empirical examples are presented (and in part recalculated) using UNOCHA's Global Focus Model as well as data from the Cambodia 2011 floods assessment.
In parallel with recent developments in multidimensional poverty measurement, I take a middle ground position between one-tells-all measures and indicator dashboards. This approach relies on subindices, each combining some substantively related indicators. The measured units can be visualized in scatterplots or Venn diagrams.
These links mirror the same two files that are available on the ACAPS resource page: The analysis note (.pdf) is accompanied by an Excel workbook (.xlsx).
2012 - For the Assessment Capacities Project (ACAPS) in Geneva, I created templates for data management and data analysis in needs assessments that take place under considerable time pressure, such as after sudden-onset disasters.
The templates come as MS Excel workbooks and are explained in detailed notes. They assist assessment teams who collect information on several levels (sites, sectors and key issues) while focusing on the severity of needs. On the data management side, the emphasis is on easy adaptation to new disaster contexts, speedy data entry, and readiness for analysis. The analysis, demonstrated with real data from Yemen, rapidly reduces the complexity of issue formulations and severity judgments. It does so with the help of built-in automatic recoding, rule-based treatment of key issues and stopping rules for when the analysis should end.
These links mirror the same four files that are available on the ACAPS resource page: 1. data management note (.pdf), 2. data management template (.xlsm; your Excel must be macro-enabled), 3. data analysis note (.pdf). 4. data analysis demonstration (.xlsx). ACAPS offers a variety of other assessment-related resources. These documents speak to a particular "one case - one or more records" data situation; for guidance on the more common "one case - one record" datasets, see further above.
2011 - Needs assessments in disaster-affected communities produce data that express priorities or ordered preferences, such as about urgent needs, or preferred coping strategies. Visualizing differences in the priority measures by respondents (e.g. affected communities) or by items (e.g. sectors) can be problematic. "Heat maps as tools to summarize priorities" offers a simple, yet effective tool for Excel users. The companion demo workbook is here. This technical note resulted from work for the Assessment Capacities Project (ACAPS), Geneva.
2010/11 - Survey data entry needs an optimal balance between reliability, cost and timeliness. Within that triangle, the degrees of (de)centralizing the work and of pre-defining category sets are critical parameters. "Efficient Survey Data Entry. A template for development NGOs", created for and with Friends in Village Development Bangladesh (FIVDB), combines, on a spreadsheet platform, ergonomic benefits and data validation features with the flexibility to adjust category sets and response codes locally. General considerations in a survey quality perspective, technical implementation as well as field experience are detailed in the report while the technically interested reader may find easily adaptable macro code in this demonstration workbook.
2010 - In clustered data (e.g., individuals in households), it may be desirable during analysis to create a new variable set to the value of a particular attribute of a particular member (e.g., the education level of the household head). The required data manipulations may not be straightforward. Similar challenges can arise in matching two lists (e.g., children from a household survey and students from school registers) with different record formats. "What are your parents' names?" is a technical note offering solutions for MS Excel, MS Access as well as STATA users, together with demo files.
2010 - Co-authored with others, "Managing humanitarian information in Iraq" has appeared as a chapter in "The Routledge Handbook of War and Society".
2010 - “Text Analysis under Time Pressure: Tools for humanitarian and development workers” reviews two external tools and offers some of my own, geared to support evaluators, project monitors and researchers who struggle with too many text documents or too little time to penetrate them. The tools are at three different levels, yet all can be learned in very short time. TextSTAT is a versatile concordance and navigation tool. The spreadsheet program Excel supports text analysis; in version 2007, a network analysis add-in helps to visualize results. I contribute macros for term frequency and term association tables. Finally, STATA users created Wordscores, a suite of procedures for large word frequency tables with word stemming. I discuss the pros and cons of climbing higher on the learning curve, to text analytics and qualitative research software. - The macros can be found in a VBA module of this Excel workbook.
2009 - In an issue brief written for the Small Arms Survey and ActionAid,
"Tracking violence in Timor-Leste: A sample of emergency room data, 2006–08", the focus is on the challenges that organizations in poor countries face in keeping track on what is going on within their walls as well as in their relevant tasks environments.
In the course of three visits with the major hospital in Dili, I came to enjoy working with the handful of persons who tried to keep tabs on the patient flow. Despite the heavy United Nations presence and its many affiliated monitors, they were the ones who chiefly contributed to injury surveillance in the country.
2008 - Relief workers sometimes have to match two or more lists of persons (food aid recipients, camp populations, missing persons, patients, etc.) or localities (villages of origin; populated places in two administrative gazetteers). This technical note demonstrates a procedure making record linkage more efficient in the presence of frequent spelling differences. Two methods are described, one in the statistics program STATA, the other in other in MS Excel, the application that most humanitarian data managers use. The data is from Tanzania. - 2012 : "Near merges", matching records by group as well as by an approximate numeric variable, can be equally challenging. The problem typically arises when the match is on group and on measurement date, but the dates for the to-be-matched records in the source and destination tables differ. Solutions are again given in Excel as well as in STATA, with demo files.
2007 - Poverty-alleviation policies and humanitarian mine-action strategies should be seen as mutually dependent. This dependency, however, is nuanced and cannot be thought of as a simple linear association between contamination and poverty or poverty alleviation and explosives mitigation. While both aim to inform national strategies, the suitability of particular project types for local community development has to be assessed by looking at several information bodies and by actively involving the affected populations. In Armenia, the UNDP implemented a Landmine Impact Survey as well as a Human Development Survey, although separately from each other. By linking the two data bodies, Charles Conley and I demonstrate new findings about mine-affected communities from a poverty-alleviation perspective. The paper appeared in the Journal of Mine Action, vol. 11(1).
2006 - "Survivor Needs or Logistical Convenience? – Factors shaping decisions to deliver relief to earthquake-affected communities, Pakistan 2005-06" merges a United Nations logistics database with external data sources in order to test Waters' “Bureaucratizing the Good Samaritan” thesis. Heckman selection models are used to examine whether the extreme logistical challenges of "Operation Winter Race" distracted humanitarian agencies from the needs of the people they were supposed to assist, in favor of other values that their institutional frameworks dictated. In addition, Bayesian semi-parametric models document how the influence of different needs indicators changed over time. - This study was done for the Veterans For America / Information Management and Mine Action Programs. - A shorter version appeared in the journal "Disasters", vol. 33(1). - "Runs of Relief" (2007) adds a technical note for humanitarian logistics analysts wanting to use similar data to estimate effects on operational, rather than short-term tactical, decisions in allocating relief.
2006 - Local communities in post-war countries recover unevenly. Do those in more favorable socio-economic conditions offer their residents better security? Do threats to life and the integrity of persons diminish apace with the recovery, or do they linger at elevated levels until growth and development have crossed certain thresholds? Should policy assume that economic opportunity and public service provision will take care of the risk of violent conflict, or does it call for direct intervention? - In "A Semi-Parametric Spatial Regression Approach to Post-War Human Security: Cambodia, 2002-2004" we investigate those questions tapping into a monitoring system on domestic violence, land conflicts and serious crime that the government of Cambodia operated in over 15,000 villages and urban neighborhoods. - This study was conducted, together with Taylor Owen and Håvard Rue, for the International Peace Research Institute, Oslo (PRIO). - A shorter version has been accepted by the Asian Journal of Criminology and should appear in late 2008. A statement on replication is being offered at its Web site; this statement refers to data, command batch and select output files held in a zip file here.
s
2005 - "Rapid Humanitarian Assessments – How Rational? A Value-of-Information Study of Two Assessments in Iraq" addresses the question of how rationally humanitarian agencies use one of their standard tools - rapid assessments. This extensive study was motivated by the geographical overlap of two large-scale assessments that took place under UN auspices in northern Iraq after the U.S. invasion in 2003. We build a predictive model of whether the second assessment teams would visit a local community, or not, in terms of covariates some of which had been collected under the first exercise. We operationalize three concepts thought to guide assessment personnel: "mental maps", "policy guidance" and "local experts and key informants". For the 2,425 observed communities, the prediction is correct in 79 percent. In a second step, we construct an importance measure for the information from each of the 1,139 communities that the second assessment visited. We use this measure and the dates of the visits in order to calculate the average information cost as it evolved over the 317 days of survey lifetime. We discuss the need for stopping rules in humanitarian data collections and propose a sequence of smaller community assessments as an alternative. - This study, too was done for the Veterans For America / Information Management and Mine Action Programs. A shorter version appeared in the journal "Disasters", vol. 21, no. 1.
2005 - "Emergency Surveys in Humanitarian Mine Action - Elements of a Protocol", co-authored with Kim Spurway, is the result of a mission in eastern Congo. Emergency surveys need a methodology that integrates them tightly with the technical requirements of Humanitarian Mine Action, notably clearance and disposal. One of the objectives is to accelerate the response to the needs of surveyed communities. This note addresses some of the recurrent challenges in emergency surveys and delineates possible solutions. Rather than being a practical handbook, it discusses a number of conceptual and organizational issues. These are interwoven with elements of practical action, including a catalogue of minimum information fields and a sample questionnaire.
2005 - "Putting the Pieces Together: Follow-up of persons with disabilities using multiple indicators" analyzes pre- and post-treatment data on mobility-impaired patients in Vietnam. It assesses improvements in personal hygiene, mobility, cognitive ability and social integration. Patient independence indicators in those four domains had been selected by the program staff. Each indicator formed an ordinal scale; reducing this information through polychoric principal component analysis improved on the naive averaging of gains over all the indicators in a given domain. More importantly, the challenges that the local staff were facing in monitoring program impact confirm the rule that data reliability and management need to be mastered even before model validity and inference can be productively tackled. Substantively, the data indicates that program participants achieved gains in social integration that were even more significant that those in the other three domains, which were also positive.
2004 - Like other wars, recent Western military interventions have entailed large losses of civilians in the affected countries. In the spirit of the ‘Revolution in Military Affairs’, some have claimed that those losses were much smaller than the loss of life as a result of previous misrule and oppression, and that during these interventions civilians suffered only accidental ‘small massacres’. In "Civilian Victims in an Asymmetrical Conflict: Operation Enduring Freedom, Afghanistan", Lawrence Moulton, of Johns Hopkins University, and I use victim figures from a survey of 600 local communities exposed to hostilities during Operation Enduring Freedom in Afghanistan to test these claims. We model community victim counts as a function of potential explanatory factors via zero-inflated Poisson regression. - The paper appeared in the "Journal of Peace Research", vol. 41, no. 4.
2003 - "Integration of Different Data Bodies for Humanitarian Decision Support: An Example from Mine Action" illustrates dilemmas of humanitarian data management. In this field, data integration has been fostered not only by the diffusion of GIS technology, but also by institutional changes such as the creation of United Nations-led "Humanitarian Information Centers". But there is a question whether the analytic capacity is in step with aggressive data acquisition. Humanitarian action may yet have to build the kind of strong analytic tradition that public health and poverty alleviation have accomplished. Seizing an opportunity presented by the Lebanon Landmine Impact Survey, we demonstrate that model-driven data integration leads to non-trivial insights for humanitarian policy. In this event, we merge community-level with agricultural census tract data and use ordered logit regression to estimate land use ratios in response to contamination severity and year of exit from hostilities. - The study appeared in "Disasters", vol. 27, no. 4.
2002 - As a sample of how I work on the data collection side, I add a version of the annotated questionnaire that I created for the Landmine Impact Survey. This multi-country survey was being challenged by centrifugal tendencies, given the greatly diverse conditions in the participating countries and the different professional composition of country management teams. Between 1999 and 2002, I created most of the survey protocols and training syllabi (except GIS and database), trying to strike a balance between the need for global comparability (rooted ultimately in advocacy needs) and for flexibility to accommodate country-specific factors. My approach was to couch specifications, wherever possible, in explicit rationales, both for the instrument as a whole and for lower-level technical points that the country teams would explain in staff trainings or modify in response to the pre-test findings. This way, supervisors and trainers could find out identically why things had to be done within certain bands of discretion.
Generally, this was well appreciated among country team members with a social science background. But I had to learn the hard way that some of the managers with an engineering background found detailed reasoned prescriptions useless. The concept of measurement error and our interest to minimize it meant little to them. Their presumption was that data collectors and interviewees understood the landmine and unexploded ordnance reality well enough in order to work with succinct check lists. In fact, as one of them (in Kosovo), explained to me: "When I am done listening to the group [of key informants from a contaminated local community], I go back to my jeep, roll up the window, and fill out the whole thing myself." He sure got done more than any of us social constructivists ever will ..
1999 - "Network Without Centre? A Case Study of an Organizational Network Responding to an Earthquake" grew out of the evaluation that I conducted of the Red Cross Movement response to a disaster in northern Afghanistan. It was published in the Journal of Contingencies and Crisis Management, vol. 7/1. Network concepts had been around in the humanitarian world since Randolph Kent's Anatomy of Disaster Relief (1987), but ten years' later this paper was one of the first to look at structural features of a response network. This has since changed, through the application of more formal network analysis concepts in a number of disaster studies. Another ten years later, what the reader may still find stimulating, is my way of tabulating the delay structure of the response and diagramming partner preferences among UN, Red Cross and NGOs.
1998 - My last mission with the International Committee of the Red Cross took place in South Africa, in 1993 - 94. Seeing an odious political regime come to an end was a very satisfactory conclusion, and having contributed, in whatever tiny measure, to the largely peaceful transition, was immensely gratifying, in contrast to several intractable conflict theaters from which I had departed without much hope for the countries and the people with whom ICRC delegates worked together personally. South Africa offered me also a collaboration with two local researchers whose conflict analyses contributed to the new government's decision to postpone local elections in the volatile Kwazulu-Natal province three times during 1995 - 96.
"Persistent Collective Violence and Early Warning Systems: The Case of Kwazulu Natal, South Africa" is two things in one: a study of a networked violence monitoring system in an early warning perspective, and an analysis of the violence dynamics using the data that the system collected. Monthly fatalities from political violence, segregated for the two major antagonists, feed into a system of action-reaction equations; we estimate the effects of reciprocity ("it-for-tat") and of inertia (previous violence) for periods before and after the April 1994 national elections. - The study, written together with Anthony Minnaar and Sam Pretorius, appeared in "Armed Forces & Society", vol. 24, no. 4.
1997 - "Uncertainty and Information Flows in Humanitarian Agencies" was inspired by the 1996 review of "Operation Lifeline Sudan", in which I took part as a "relief economist" (that's what the UN contracts manager called me ..). A computer simulation underlines the point that uncertainty grows out of the internal complexity of the agencies themselves, rather than simply emanating from their war-ridden environments. But the focus of this paper, which appeared in "Disasters", vol. 21, no. 4, is on the philosophical treatment of the uncertainty concept (and of certainty substitutes) in this particular institutional complex, borrowing from Smithson's typology of ignorance and from organizational theorists such as Stinchcombe's "Information and Organizations". Although written more than twenty years ago, I believe that the paper still has value for the education of the new generation of relief workers and humanitarian policy students.
1996 - With an Ebola epidemic currently (August 2014) raging in parts of West Africa, some readers may be interested to have access to "Ebola Virus: From Medical Emergency to Complex Disaster?" This paper describes the Ebola outbreak in Zaire (now DR Congo) in 1995, the dynamic of the international response incl. the media attention curve, and differences vis-à-vis an earlier outbreak in the same country in 1976. It was published in the Journal of Contingencies and Crisis Management in 1996.
1993 - "Simulation of the Effectiveness of Protection and Assistance for Victims of Armed Conflict", my second published computer simulation, translates into a formal model intuition that I built, as an ICRC delegate in Mali in 1991, of the dynamics of ethnic violence and its reduction in response to protection and assistance activities for the civilian population. As a field person (and later deskman at Geneva HQ), I was divorced from academic conflict studies and had to build a simulation sensitive to place, history and humanitarian policy mix with the conceptual tools on hand. Some of them were rather unorthodox, such as interacting social clocks that translate events into levels of tension and hence new violence. The irony of it all was that I was able to present this paper at a computer simulation conference in 1993, filling the slot of a researcher from former Yugoslavia who could no longer travel because of the ethnic violence in his country! - "Journal of Contingencies and Crisis Management", vol. 1, no.4.
1991 - I wrote a simulation of relief food distributions and their impact on the mortality of a distressed population while serving with the ICRC in Wau, a besieged town in southern Sudan. The scenarios, produced on a nine-needle printer during rare electricity supplies, helped the local relief committee to defend difficult choices and the donors to realize that the decision-making autonomy of the affected community should be respected. Arguably one of the first in the humanitarian field, this computer simulation was technically crude, yet unique as an unorthodox improvisation "from the edge of the known world". "Computer Simulation as a Means of Dialogue between Local Committees and Relief Agencies" later appeared in "Disasters", vol. 15, no. 4.
More papers will be added gradually. If you experience difficulty accessing any of these papers, please send a request to
abenini [a t] starpower [ dot ] net [address broken up to thwart spammers]
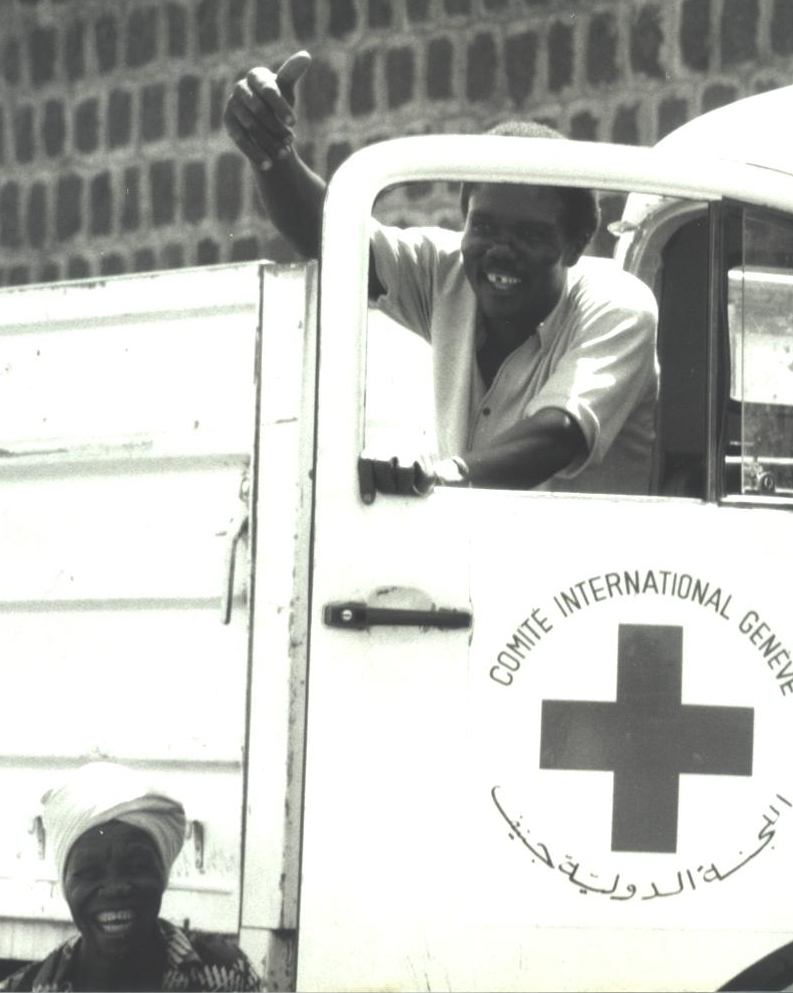
I took this photo inside the besieged city of Wau, southern Sudan (now South Sudan), in 1990 when I was the head of the ICRC sub-delegation there.
Back to Home page
Last updated: 28 January 2022